The lastest U.S. Cannabis Consumer Survey, produced by Ganjapreneur, captured the shopping habits, product preferences and demographic profile of over 1,040 cannabis consumers. By surveying how often they buy from dispensaries, what they spend, the products they buy, their willingness to try new brands and the factors that matter at the shelf, the report offers actionable insights for cannabis companies. This article summarizes the survey results and interprets what they mean for cannabis brands seeking to succeed in an increasingly competitive marketplace.
National research shows that cannabis use among older adults has surged; a 2025 study reported a 46 % increase in cannabis use among people aged 65 and over between 2021 and 2023 link. This broader trend of seniors embracing cannabis underscores why our survey includes so many respondents over 55.
For additional context on why seniors are turning to cannabis, a Harvard Health review reports that older adults increasingly use medical marijuana to manage chronic pain, insomnia, neuropathy and anxiety, although it cautions that cannabis can raise heart rate and interact with medications. Axios similarly notes that marijuana use among seniors jumped 46 % from 2021 to 2023 and that 7 % of adults aged 65 and older used cannabis in 2023.
How often people visit dispensaries and how much they spend
One of the most fundamental questions for brands is how often consumers visit dispensaries and how much they spend per trip. The survey shows that over half of respondents purchase cannabis at least monthly. About 32.47 % of consumers buy from a dispensary about once a month, while 24.50 % visit less than once a month. A sizable minority buy more often: 21.90 % shop every two weeks, 14.22 % once a week, and 6.92 % shop twice a week or more.
In terms of spending, the largest group of shoppers are high‑spend customers: 43.21 % spend more than $100 per trip. Another 37.34 % spend $50–$100, whereas 16.55 % spend $20–$50 and only 2.89 % spend $10–$20.

Figure 1. Frequency with which survey respondents purchase cannabis from a dispensary.

Figure 2. Amount consumers typically spend per dispensary trip.
Insights for brands: The data reveal two key patterns. First, most cannabis shoppers are regular rather than frequent buyers; monthly or bi‑weekly visits dominate. Brands that rely solely on weekly purchases should consider loyalty programs and subscription services to increase visit frequency. Second, there is a sizable segment of high‑value customers spending over $100 per trip. Premium product lines, bundle deals and personalized recommendations can capture this group’s disposable income. At the other end, a small but important segment spends under $50; value‑oriented products and small package sizes can target them.
These shopping patterns mirror broader industry statistics showing that nearly half of Americans have tried cannabis, the legal industry supports more than 440,000 jobs and sales are projected to reach $45 billion by 2025.
What products people buy
The survey asked consumers what types of products they usually purchase from dispensaries (multiple answers were allowed). The results show that the traditional flower market remains dominant, but edibles and vapes are also important. 73.23 % of respondents buy flower or buds. Edibles and gummies are purchased by 59.37 %, making them the second‑most popular category. Vape cartridges and vapes are selected by 47.23 %, while prerolls/joints attract 38.05 %. Extracts/dabs are more niche at 26.48 %, and 17.97 % choose ‘other’ products.
In addition to joints, another rolled format is the blunt—a cigar or tobacco‑leaf wrap filled with cannabis. Blunts have a dedicated following in many markets; readers can learn how to roll one in this handy guide.

Figure 3. Products that cannabis consumers purchase at dispensaries (respondents could select multiple).
Insights: The data reflect the diversification of the cannabis market. Flower is still the anchor product, but edibles and vape products have crossed the 50 % adoption threshold. Brands should maintain a broad product portfolio: flower to satisfy traditionalists and edibles/vapes to capture new segments such as health‑conscious or discreet consumers. The popularity of gummies demonstrates that flavor, convenience and dose control are critical; companies should invest in flavour technology and consistent dosing.
Edibles differ from inhaled products in more than flavor: they deliver a slower onset and longer‑lasting effects, so experts advise consumers to “start low and go slow.”
Pre‑rolled joints have also become a booming category: another report showed that U.S. consumers spent more than $4 billion on pre‑rolls between 2023 and mid‑2024, reflecting growing demand for convenient formats. Another rolled option is the blunt—a cigar or tobacco‑leaf wrap filled with cannabis. Blunts have a dedicated following in many markets; readers can learn how to roll a blunt in this handy guide.
Beyond buying finished products, some enthusiasts are taking the plunge into home cultivation. Our guides to buying cannabis seeds and scrogging marijuana plants provide step‑by‑step advice for growing high‑yield plants. Retailers who want to broaden their offerings can explore CBD wholesale opportunities and wholesale CBD gummies to source products at scale.
For consumers who prefer classic paraphernalia, water pipes remain a popular way to enjoy flower; our primer on what a bong is explains how these devices work, and this cleaning guide offers tips for keeping your glassware sparkling.
Loyalty and preferred communication channels
When asked whether they use loyalty points for discounts at dispensaries, 28.43 % of respondents said they do not participate in any rewards program, whereas 33.53 % use loyalty points at a single dispensary and 32.08 % use them at multiple dispensaries. Only 5.96 % are unsure.
Regular promotions and weed deals (e.g., seasonal discounts or buy‑one‑get‑one offers) can also enhance loyalty by giving shoppers a reason to return; this weed‑deals guide provides concrete examples.
Not sure where to shop? Our dispensary finder helps you locate cannabis dispensaries and see reviews, photos and directions in your area.
The survey also explored how consumers prefer to learn about specials and deals. The most popular method was checking the dispensary’s website before ordering (47.64 %), followed closely by signing up for the email newsletter (43.50 %) and signing up for text‑message alerts (39.94 %). About 24.25 % like asking a budtender in person, 22.23 % follow the dispensary on social media, and only 8.85 % are indifferent to specials.

Figure 4. Preferred channels for hearing about specials or deals at dispensaries.
Insights: Loyalty programs are widely used. Two‑thirds of consumers collect points from at least one dispensary, suggesting that robust loyalty schemes are essential. These programs not only encourage repeat visits but also allow brands to collect valuable behavioural data. On the communication front, the website remains the top source for deals, but email and SMS are nearly as important. A multichannel marketing strategy is mandatory: ensure that websites clearly display promotions, maintain an active email list and offer opt‑in text alerts. Social‑media promotions are less preferred than direct channels, but they still reach one‑fifth of consumers and can be used for brand storytelling. Budtender recommendations matter for about a quarter of respondents, indicating the ongoing role of in‑store staff in influencing purchases.
Marketing success hinges on more than discounts: building a strong brand identity, developing a content strategy and partnering with influencers are key pillars of any modern cannabis marketing plan. Check out this case study video of how Growth Skills out partner agency helped Find Wunder more than double their revenue.
Favorite dispensaries and brands
When asked about favourite dispensaries, 37.18 % of respondents have one favourite, 42.94 % have several favourites, and 19.88 % do not have a favourite dispensary. The pattern is similar for product brands: 51.97 % have a few favourite cannabis brands, 17.45 % have one favourite and 30.58 % have no favourite brand.
Insights: Loyalty is distributed across multiple stores and brands. Consumers are open to shopping at more than one dispensary and to buying multiple brands. This fragmented loyalty suggests that a strong brand must compete at every point of the customer journey: high product quality, competitive pricing and consistent customer experience across locations. Brands should invest in brand recognition campaigns—such as distinctive packaging and educational content—to become a consumer’s first choice. Additionally, retailers can differentiate themselves through personalized service, curated selections and community events to cultivate a “favourite” status.
Cannabis connoisseurs looking for inspiration can explore our list of the best cannabis brands—it highlights high‑end luxury labels as well as affordable up‑and‑comers.
Openness to trying new products
The survey asked how often shoppers try products or brands they have never purchased before. Nearly half (46.97 %) said they occasionally try new products, 34.68 % do so fairly often, 9.51 % very often/always, and 8.84 % rarely or never.

Figure 5. How frequently consumers try new cannabis products or brands.
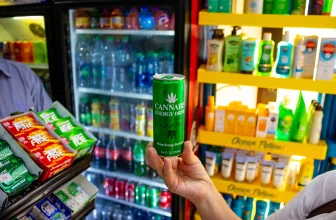
Another emerging category in the discovery space is THC‑infused drinks. These beverages—ranging from sparkling seltzers to mocktail‑style tonics—offer a social and discreet way to consume cannabis and can appeal to consumers who avoid smoking or want a lower‑dose experience. Similarly, tinctures provide a discreet, sublingual option that offers precise dosing without smoke or sugar.
Insights: There is a strong appetite for discovery. More than three‑quarters of consumers occasionally or often experiment with new products. For brands, this openness represents an opportunity to gain shelf presence and to run sampling programs, limited‑time flavors or strains, and cross‑promotional bundles. Dispensaries can leverage this curiosity by offering “discovery boxes,” rotating deals and budtender recommendations. Those who rarely try new products (about 9 %) may value consistency and trust; targeted messaging about reliable quality and incremental innovation could appeal to them.
Influence of THC potency and pricing
The role of THC potency in purchase decisions was nuanced. Only 18.62 % of respondents shop primarily for products with the highest THC potency, while 43.28 % say potency is important but not the most important factor. A sizeable 29.37 % look at potency but do not consider it important, and 7.68 % do not care about THC potency. About 1.06 % are unsure.
Price sensitivity shows a more even distribution. 42.40 % usually shop for products in the “middle‑shelf” price range. 24.10 % prefer top‑shelf products, 16.17 % look for the lowest‑priced products, and 17.33 % are unsure.
Insights: The moderate influence of THC potency counters the assumption that “higher is always better.” Brands should not focus solely on maximising THC levels; instead, they should communicate flavour profiles, terpene content, strain lineage and experiential effects. Education about balanced products and minor cannabinoids will resonate with the large segment that values potency but does not consider it the top factor. Pricing strategy should recognise that the majority of consumers are mid‑tier shoppers: offering good‑quality products at fair prices, perhaps through tiered lines, will capture this group. Premium consumers (top‑shelf) still account for one‑quarter of the market; limited‑edition strains and artisanal production methods can justify higher prices.
Emerging cannabinoids like delta‑8 THC also attract curious consumers seeking a milder psychoactive experience; brands should monitor regulatory developments and consumer interest when considering such products.
Research underscores that cannabis use isn’t only about potency: a Journal of Cannabis Research study found that patients experienced significant improvements in physical, social and emotional well‑being after three months of medical marijuana treatment.
Demographics – who is buying?

The survey reveals a demographic profile skewed towards older adults. Among respondents, 29.32 % are aged 65 or over and 24.30 % are 55–64, making seniors the largest group of cannabis consumers. Younger demographics are less represented: 18.61 % are 45–54, 15.04 % are 35–44, 9.64 % are 25–34 and only 1.83 % are 21–24.
Income distribution shows that 29.37 % of consumers have annual incomes below $50 k, 19.48 % earn $50–$75 k, 14.01 % earn $75–$100 k, 11.52 % earn $100–$150 k, 8.45 % earn $150–$250 k, 4.51 % earn over $250 k, and 12.67 % prefer not to say.
Insights: These demographics challenge stereotypes of cannabis as a youth product. Older adults—many of whom may use cannabis for wellness—constitute a major market segment. Brands should ensure that packaging is readable, dosing instructions are clear, and marketing does not rely solely on youthful imagery. The income data show that most consumers fall into lower‑ to middle‑income brackets, reinforcing the need for affordable, value‑driven products. However, the presence of higher‑income shoppers suggests room for premium segments.
Chronic pain is one reason many older adults turn to cannabis; developing formulations tailored to pain relief and educating consumers about effective cultivars can improve product‑market fit. Readers can explore suitable strains in this strains‑for‑pain‑relief guide.
Anxiety is another common reason for consuming cannabis; our guide to strains of weed for anxiety highlights cultivars such as ACDC and Northern Lights that users report help them relax without overwhelming psychoactivity.
According to the Centers for Disease Control and Prevention, about 52.5 million Americans used cannabis in 2021 and 3 in 10 users meet the criteria for cannabis use disorder—important context when considering the public‑health implications of rising consumption. If you’d like to explore how legalization is unfolding in different regions, see our analysis of Pennsylvania’s cannabis legalization and other state‑specific case studies.
Geographic distribution
Respondents hail from across the United States. The most represented state is California, home to 17.92 % of respondents. Other states with notable representation include Florida (7.51 %), Nevada (7.23 %), Massachusetts (3.85 %), Michigan (3.76 %), Illinois (4.05 %) and Maryland (2.31 %). Many states contribute under 2 %, reflecting a geographically dispersed market.
Insights: California remains the largest single market, but the diversity of states suggests opportunities in emerging markets. Brands should pay attention to regional regulatory frameworks and consumer preferences. For example, edibles might be more popular in Florida (a medical market) than in California, while premium flower might command higher sales in Nevada’s tourist‑driven market. Localised marketing campaigns and state‑specific products can help brands resonate with regional audiences.
In states with mature regulations, weed delivery services offer additional convenience by delivering cannabis directly to consumers’ doors. Retailers who excel at online ordering and prompt delivery—like those highlighted in this New York weed‑delivery guide—can capture customers who value discretion and time savings. The regulatory environment also shapes market potential: in states such as New York, recent legalization has opened the door for new dispensaries, delivery services and social‑consumption lounges, whereas other states remain medical‑only.
For a deeper dive into specific markets, check out our California cannabis market analysis and Pennsylvania legalization overview.
What matters most when shopping for cannabis
To understand the attributes that influence purchase decisions, the survey asked respondents to rate various factors from “not important” to “extremely important.” Weighted averages (on a scale of 1 to 4) indicate the relative importance of each factor. The top‑ranked factors were Flavor/Taste (3.24) and Strain (Sativa/Hybrid/Indica) (3.01). THC potency (2.82) and Aroma/Smell (also 2.82) were tied for third place. Appearance scored 2.80, while THC/CBD ratio (2.56), Other cannabinoid content (2.48) and Organic certification (2.52) were mid‑priority factors.
Price‑oriented factors ranked surprisingly low: Low Price had a weighted average of 2.46, and Harvest Date was similarly rated at 2.46. The Specific Brand factor scored only 2.12, and Online Reviews were the least influential at 1.96.

Figure 6. Weighted-average importance scores for various factors when shopping for cannabis products (1 = not important, 4 = extremely important).
Educating customers about terpenes—the aromatic compounds that contribute to taste and effects—can further differentiate products; this terpenes guide explains how these compounds interact with cannabinoids to shape the cannabis experience.
For a science‑based overview of these aromatic molecules, Healthline explains what terpenes are, how they contribute to cannabis’s aroma and how they might influence the effects of different strains link.
Insights: Consumers prioritize sensory and experiential qualities over price. The dominance of flavour and strain type suggests that terpenes, taste profiles and desired effects drive purchasing decisions. Brands should invest in product development to deliver complex flavours, consistent terpene profiles and clear strain information. Packaging should highlight sensory descriptors and strain classification to catch shoppers’ eyes.
Price and brand loyalty matter but are secondary. Low price scored modestly, indicating that consumers are willing to pay for quality. Therefore, rather than a race to the bottom on price, companies should focus on value—delivering an enjoyable and reliable experience that justifies the cost. The low importance of online reviews suggests that cannabis shoppers rely more on personal experience, word of mouth and staff recommendations than on digital ratings, emphasizing the need for trusted budtenders and in‑store education. Understanding the functional differences between cannabinoids can also guide shoppers: while THC produces euphoria and intoxication, CBD provides non‑psychoactive relief for anxiety and inflammation. This CBD vs THC guide breaks down how each compound works and why consumers may choose one over the other.
Conclusion
The 2024 U.S. Cannabis Consumer Survey from Ganjapreneur paints a picture of a maturing and diverse cannabis market. Consumers are regular rather than habitual buyers, with many spending over $100 per trip. Flower remains the anchor product, but edibles and vapes have become mainstream. Loyalty programs and multichannel communications—especially websites, email newsletters and text alerts—are crucial for engaging shoppers. People often have multiple favorite dispensaries and brands and are willing to try new products, creating opportunities for innovation and discovery.
Although THC potency is considered, it is not the sole determinant of purchase; flavour, strain and aroma carry more weight. Most consumers are mid‑shelf buyers who value quality and experience over rock‑bottom prices. The demographic skew toward older adults and the broad geographic distribution highlight the importance of inclusive marketing and state‑specific strategies. Finally, the factors driving purchase decisions point to a market that values taste, aroma, and strain differentiation, reinforcing the need for product excellence, education and storytelling. By understanding these preferences and tailoring products, messaging and loyalty programs accordingly, cannabis brands can build lasting relationships with today’s sophisticated consumers.