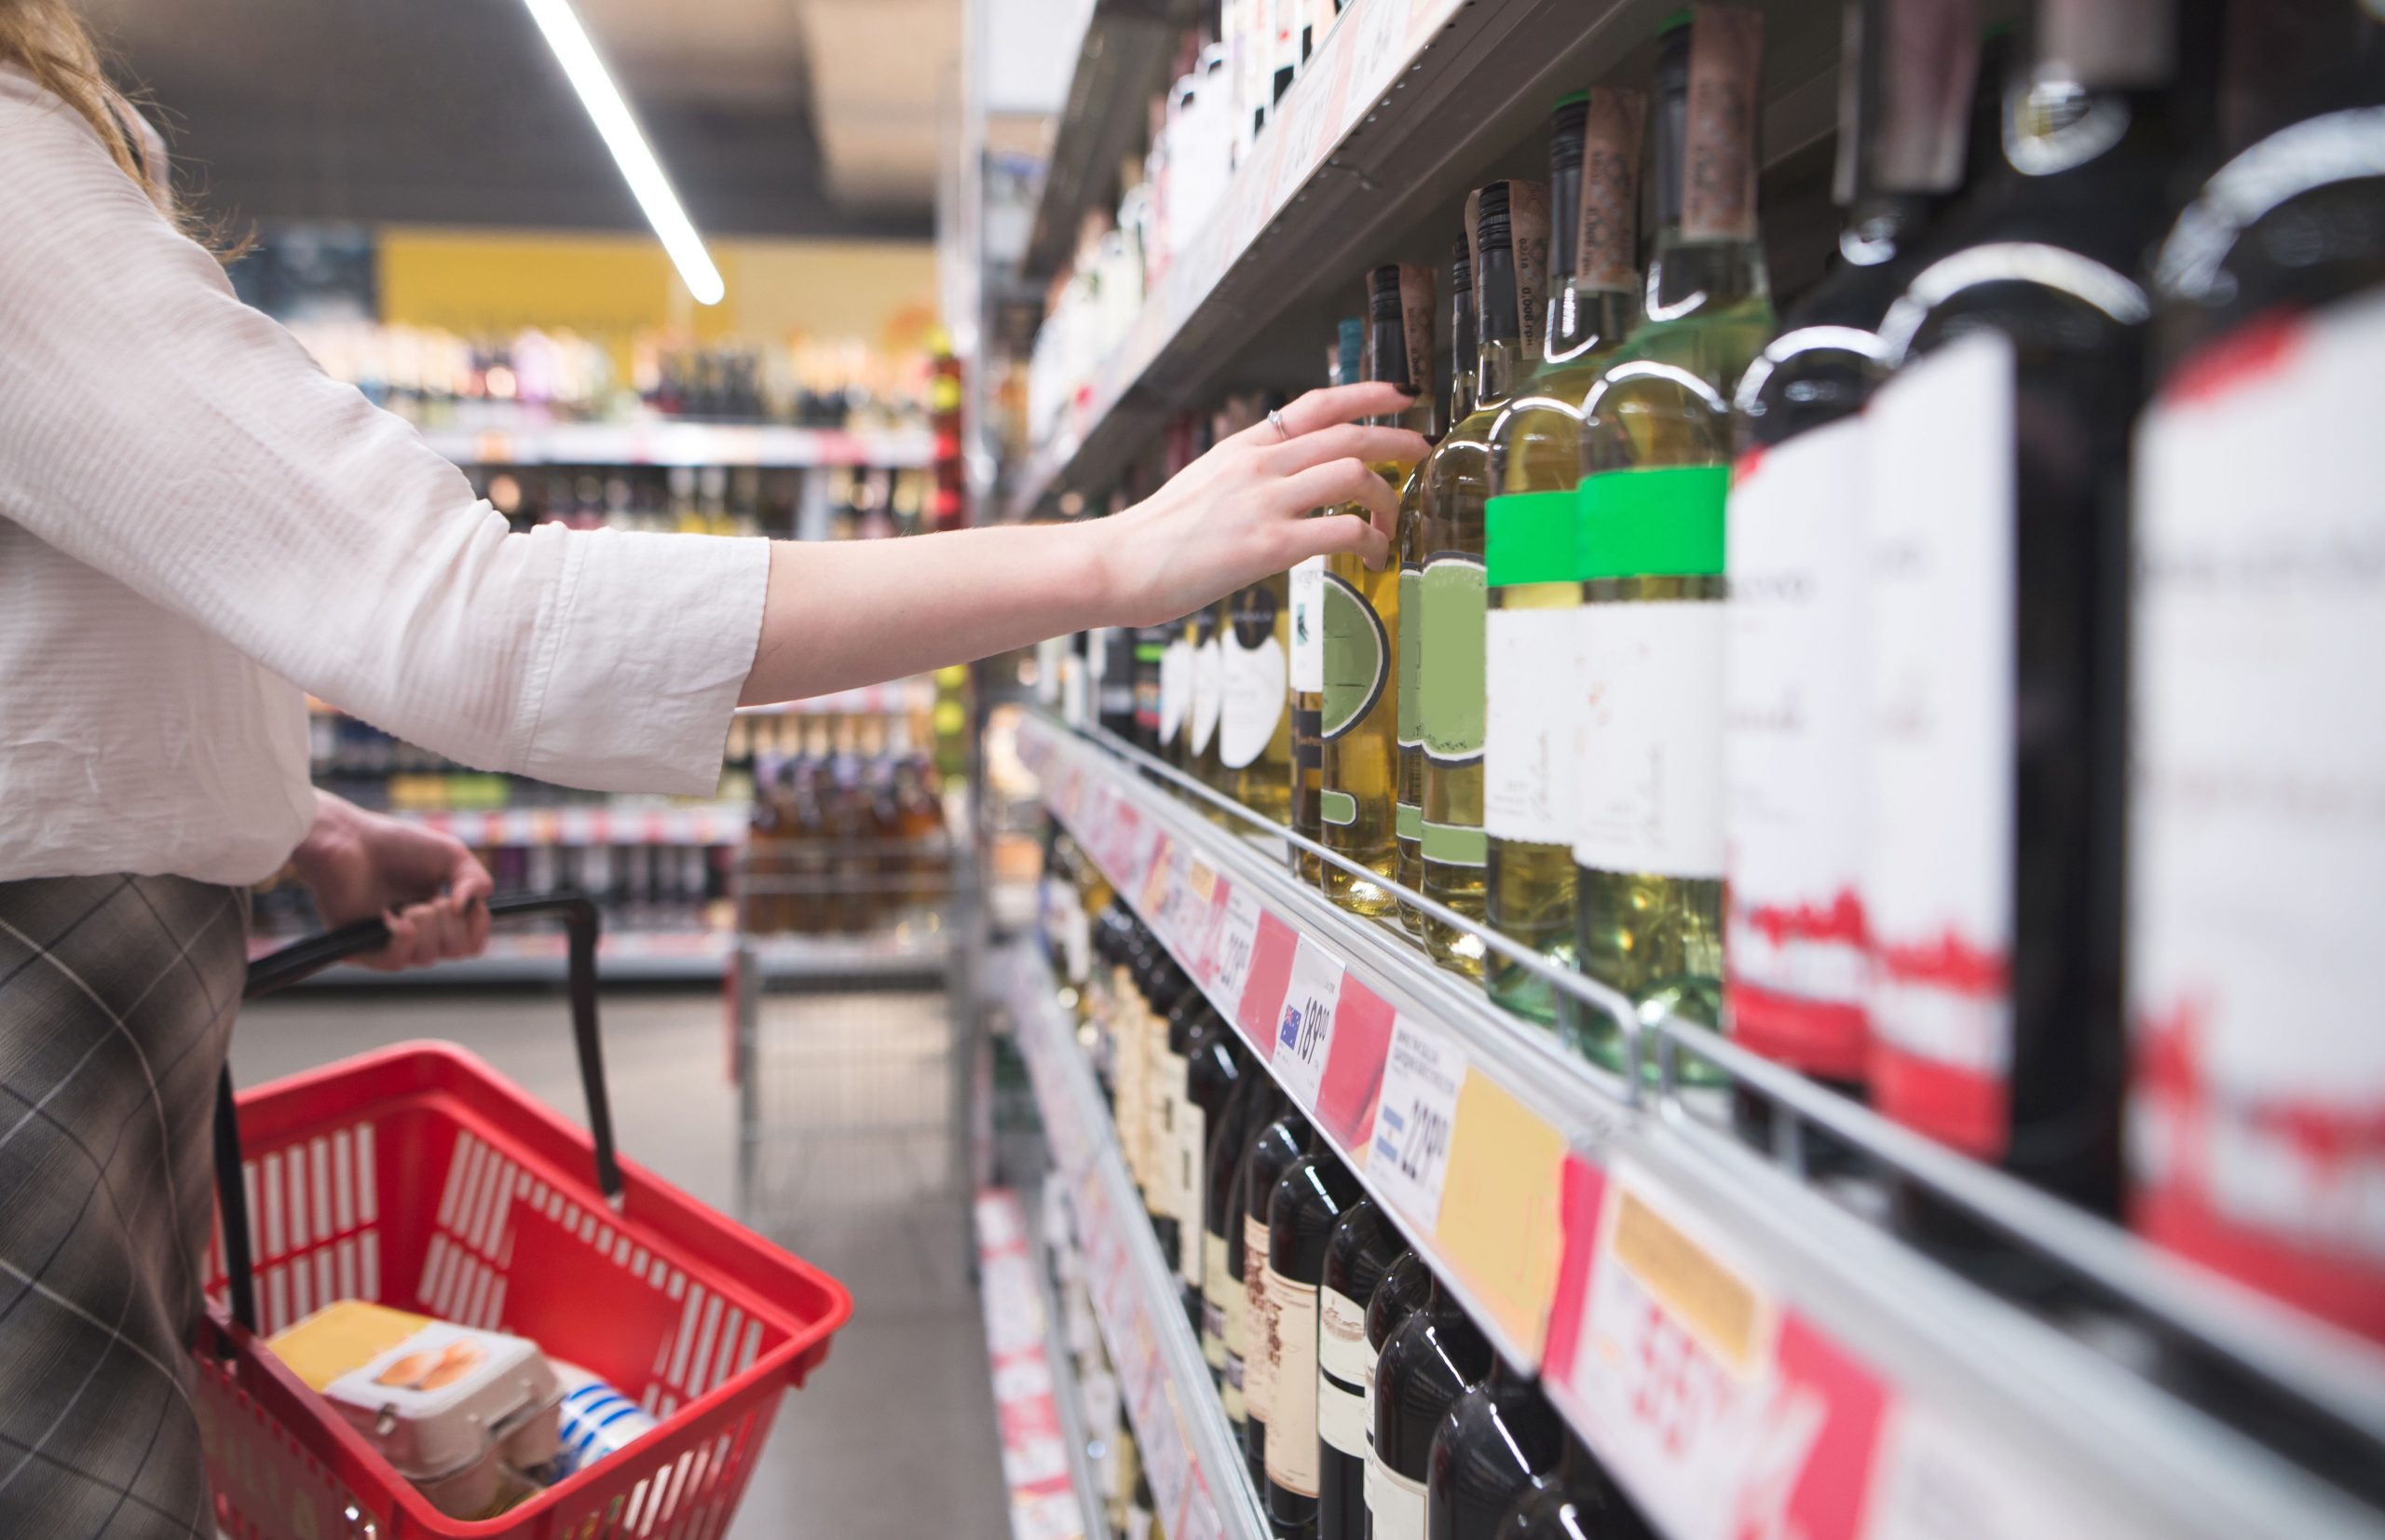
Looking for the cold, hard facts about the world of booze? You’ve come to the right place. We’ve pulled together 50 alcohol industry statistics to show you where the industry has been and where it’s going.
A few key takeaways — alcoholic drink revenue is down due to bar and restaurant closures. While we’ve all been drinking more at home since the beginning of the pandemic, we’ve been spending significantly less on alcohol overall since we’ve been buying retail.
Also, the trend toward “premiumization” continues to rise. Consumers are spending less on bargain brands and more on the high-end, artisan side of the market.
Alcohol Industry Statistics — Growth
- The compound annual growth rate (CAGR) for the alcohol market is expected to be 7.9% from 2020 through 2023.
- Liquor store revenue has grown an annualized 2.2% to $61.8 billion between 2015 and 2020.
- As of September 2020, U.S. Alcoholic Drinks revenue is down 11.7% year over year.
- While there has been an increase in alcohol sales across retail and ecommerce channels, it has not been enough to offset the losses incurred due to bar and restaurant shutdowns. The IWSR anticipates double-digit global declines in sales in 2020, which could take until 2024 to recover.
Alcohol Industry Statistics — Market Size
- Revenue in the Alcoholic Drinks market was $222,098 million as of September 2020.
- The Liquor Store segment represents a $62 billion market.
- The Bar and Nightclub segment represents a $19.9 billion market.
- There are an estimated 62,500 bar and nightclub locations in the U.S.
- Supermarket sales of beer, cider, and malt drinks were over $11 billion in 2018.
Alcoholic Industry Statistics — Employment
- The Liquor Store segment employs 187,247 people in the U.S.
- The Bar, Tavern, and Nightclub segment employs 345,000 people in the U.S.
- The American wine industry had created nearly 1 million jobs as of fall 2017.
- The U.S. beer industry created over 2.19 million jobs in 2019.Revenue in the wine segment amounts to $44,478 million in 2020.Wine revenue is down 10.3% in 2020.The compound annual growth rate for the wine market is expected to be 7.7% between 2020 and 2023.The canned wine segment has seen rapid growth. From only $2 million in sales in 2012, the segment jumped to $183.6 million between June 2019 and July 2020.The rosé category grew 48% between July 2018 and July 2019.Nearly 50% of all wineries in the U.S. are in California. The state has more than five times the number of wineries in Oregon, which has the second-most wineries.Barefoot Wine is the top-selling table-wine brand in 2020, with sales of over $673 million so far.
- The American spirits industry is responsible for 1.64 million jobs.
Beer, Wine, and Spirit Consumption
- The per-person revenues of all alcoholic drinks are $670.99 in 2020. That’s down 12.2% from 2019.
- The average per capita consumption of beer in the U.S. is 66.4 L in 2020.
- The average per capita consumption of wine in the U.S. is 11.0 L in 2020.
- The average per capita consumption of spirits in the U.S. is 5.5 L in 2020.
- By 2023, 48% of spending on Alcoholic Drinks is expected to be for out-of-home consumption, including restaurants and bars.
Wine Industry Statistics
- Revenue in the wine segment amounts to $44,478 million in 2020.
- Wine revenue is down 10.3% in 2020.
- The compound annual growth rate for the wine market is expected to be 7.7% between 2020 and 2023.
- The canned wine segment has seen rapid growth. From only $2 million in sales in 2012, the segment jumped to $183.6 million between June 2019 and July 2020.
- The rosé category grew 48% between July 2018 and July 2019.
- Nearly 50% of all wineries in the U.S. are in California. The state has more than five times the number of wineries in Oregon, which has the second-most wineries.
- Barefoot Wine is the top-selling table-wine brand in 2020, with sales of over $673 million so far.
Beer Industry Statistics
- Beer represents the alcohol market’s largest segment, with a market volume of $101,847 million in 2020.
- Beer accounted for about 45% of the U.S. alcohol industry sales market in 2019.
- U.S. beer brewers sold 203.1 million barrels of beer in 2019.
- Beer revenue is down 12% in 2020.
- Bud Light is the leading beer brand in the U.S. It shipped almost 30 million barrels in 2018, compared to Coors Light in second place with about 15 million barrels the same year.
Spirit Industry Statistics
- In 2019, spirits sales were up 5.3% in the U.S., representing an increase of $1.5 billion.
- Spirit revenues were 37.8% of the total alcoholic beverage market in 2019, up 0.5% from 2018.
- Spirit revenues are down 12% in 2020 due to the coronavirus pandemic.
- Vodka is the most popular spirit in the U.S., accounting for 31% of all spirit sales.
- Distillers sold 74.1 million cases of vodka in the U.S. in 2019, for total revenue of $6.6 billion.
- In 2019, over 26 million cases of Bourbon/Tennessee Whiskey were sold in the United States. Total revenue was nearly $4 billion.
- The bestselling cocktail of 2019 was the Old Fashioned.
- Tequila is on the rise, with sales volumes growing 180% between 2002 and 2019. In 2019, distillers sold 20.1 million cases of tequila in the U.S.
- Super Premium tequila sales have grown 1,042% between 2002 and 2019.
- In 2019, gin distillers sold nearly 10 million cases in the U.S. for total revenue of $918 million.
- The Super Premium gin market grew 32.6% between 2018 and 2019, while the Value gin market dropped by 2.5%.
- In 2019, rum distillers sold 24.1 million cases of rum in the U.S. for total revenue of $2.3 billion.
- The Super Premium rum market grew by 7.6% between 2018 and 2019, while the Value rum market dropped by 3.7%
- Flavored and spiced rums represent over 55%of rum sales.
- Tito’s Handmade Vodka is the bestselling spirit in the U.S. by volume. Sales of the brand were up 20% in 2019.
Ready to Drink
- Ready-to-drink (RTD) products like White Claw were the fastest-growing alcoholic beverage category in 2019 for the third consecutive year.
- RTD cocktail sales were up 55% in the third week of March (when lockdown began) over the same period in 2019.
- Hard seltzers account for 43% of all RTD beverages in the U.S.
- White Claw was the bestselling RTD in 2019, with $27.5 million in sales in 2019. That’s a 289% increase from 2018.
Cheers to That!
And there you have it — 50 beer, wine, and spirit statistics to whet your whistle. While on-premises sales may have taken a dive during the coronavirus pandemic, the statistics prove that alcohol isn’t suffering as badly as some other industries. It will bounce back!
The future of alcohol is in craft beer, wine, and spirits from artisanal makers. Expect to see the market for high-end brands to continue to increase as consumer preferences mature. Cognac brands are also on the rise.
And if you get the chance, invest in RTD! For a market that was practically unheard of just a few years ago, the ready-to-drink segment is headed up, up, up. Expect to see more innovation in this sector, with tasty new concoctions coming to a liquor store near you.


[…] you know that nearly half the dollars spent on alcoholic drinks are expected to be consumed outside the home, including in restaurants and bars, by […]
Will there be an update to this next month, December 2021? This are some great facts.
Stewart,
Thanks for the comment. Yeah we will get one done for December. Is there something specific you are looking for. We can pull those stats for you and get them in there.
[…] on trends that could affect your sales. For example, vodka is the most popular spirit in the U.S., accounting for 31% of all spirit sales. Ensure your software can tell you in just a couple of clicks if this trend […]